
So how many of us use Proc Means on a regular basis? I’m willing to guess a fair number of us. I’m also willing to put out there, because I know people do this – how many of you run the MEANS in SAS and then transcribe them to another dataset or another program? Yup! I knew it! And how about learning how to create a nice clean-looking table with means by a particular grouping variable in your dataset?
For this post and session, I’d like to feature 2 different aspect of Proc MEANS that I have found to be very handy:
- How to create output tables by a grouping variable in your dataset
- How to save the results of your Proc MEANS into a SAS dataset to be used or exported later on
Sample dataset to use for the code presented in this post
Data play;
input trmt measure;
datalines;
1 11
1 12
1 13
1 12
2 23
2 25
2 26
2 23
3 34
3 35
3 35
3 32
;
Run;
Creating Proc MEANS results table by a grouping variable
So let’s start with the basic Proc MEANS code. We want to calculate the overall means of our variable measure in the above dataset.
Proc means data=play;
var measure;
Run;
As a result we obtain a table that looks like this:

In our dataset we have a variable called TRMT, short for treatment. We would like to create a table that shows the Mean for each treatment level separately. To accomplish this we would use the following code:
Proc means data=play;
class trmt;
var measure;
Run;
A CLASS statement is added, telling SAS that we have a variable called TRMT that shows which treatment each observation belongs to – a classification variable. A CLASS statement also sorts the data according to the levels found within the TRMT variable. In the Proc MEANS, the final role that a CLASS statement performs, is that informs the Proc MEANS that we want to calculate the means by each level of the TRMT variable. The resulting table looks like this:

Nice and clean and very clear to read.
Default output of Proc MEANS
A couple of notes about the output before we move onto saving these results into a dataset. By default, the MEANS procedure provides the user with the following items:
- N – number of observations
- Mean
- Std Dev – standard deviation
- Minimum – the minimum value
- Maximum – the maximum value
Proc MEANS has the capability of producing a large number of statistics, including:
- STDERR – standard error
- MODE – the mode value
- CLM – the confidence limits of the mean
- Quantile statistics
- T and PROBT
- many, many more…
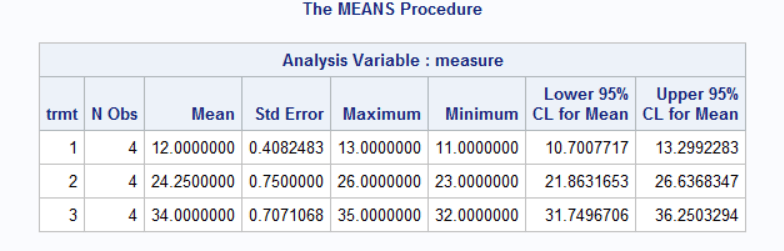
To request any of these statistics, you need to identify them on the Proc MEANS line of the code. For example, we would like to request the STDERR, the CLM, and re-order how the table appears.
Proc means data=play mean stderr max min clm;
class trmt;
var measure;
Run;
This code is requesting that the mean, standard error, maximum, minimum, and the 95% CI be calculated for each level of the treatment for the variable called measure. The following table is created:
Two pieces of code for the Proc MEANS that are very handy to have in your own SAS toolkit.
Saving your Proc MEANS results in a dataset
We have now calculated our means and they look great! But now I’d like to save these in a dataset to be used in a graph or to be added to another dataset I may have. Yes! You can easily copy and paste the values from the results table back into your Editor or into Excel. Nothing wrong with this at all! But, if you’re like me, and would like to avoid as much typing and/or copying&pasting as possible, let me show you a shortcut.
SAS is a pretty smart program and doesn’t only produce the output or results table for you, but it keeps all the data used in the table in a separate dataset. We just don’t see it unless we specifically ask for it. I’m going to start with the very basic saving the file and then show you a few more tricks to save a more detailed dataset.
Saving the basics of the Proc MEANS results table
Let’s start with the Proc MEANS coding we used earlier:
Proc means data=play;
class trmt;
var measure;
Run;
This will provide us with a table showing us the N, mean, min, and max for our measure for each of the 3 treatments in our dataset.
To save these results we will add one line of code – an output line.
output out=play_means;
the output part of this code, tells SAS that you want to save the results or the output of this procedure in a dataset. But you need to tell SAS which dataset and give it a name. That’s where the out= comes in. out= allows you to tell SAS what you will be calling the output dataset. In our example, I chose to call it play_means. If we put it all together we have this code:
Proc means data=play;
class trmt;
var measure;
output out=play_means;
Run;
The output will be unchanged from before. We didn’t change anything about what we wanted SAS to do, other than save the results. How do we know if it worked? Look at the LOG window. You should see something like this:

Now we would like to see the contents of this dataset. The easiest way to do this is to run a Proc print.
Proc print data=play_means;
Run;
The results can be seen in this PDF file.
You’ll notice that there are 3 new variables in this dataset:
- _TYPE_
- _FREQ_
- _STAT_
Each of these variables can play a big role when using the data at a later stage. Let’s start with the easy one _FREQ_ – as the name suggests it is the frequency for each observation – in other words the N used to calculate the mean. The _STAT_ denotes which statistic is in the following column. In this file we have:
- N
- MIN
- MAX
- MEAN
- STD
These 5 statistics should be very familiar by now. These are the default statistics that Proc MEANS creates.
The last variable is called _TYPE_ Best way that I can think of to explain this one would be to think of a triangle. The base of the triangle holds all the data – and this is where you would calculate the overall mean. The _TYPE_ value for the overall mean or the base is always 0. The next level up our triangle is the breakout of our 3 treatments – this is where the means by treatment are calculated. The _TYPE_value for this level is 1.
Two CLASS variables – saving the dataset
To explore the _TYPE_variable a bit more, let’s add a new column to our dataset: sex. Our dataset now looks like:
Data play;
input trmt sex measure;
datalines;
1 1 11
1 1 12
1 2 13
1 2 12
2 1 23
2 1 25
2 2 26
2 2 23
3 1 34
3 1 35
3 2 35
3 2 32
;
Run;
Then let’s run a Proc MEANS to see the treatment and sex means, and save the results in our play_means:
Proc means data=play;
class trmt sex;
var measure;
output out=play_means;
Run;
Things to remember from up above! Remember how I said that the CLASS statement sorts the data? If you look at this CLASS statement, what SAS is doing is sorting the data by sex within treatment.
Our results table looks like this:

When we look at our play_means dataset by using the following code:
Proc print data=play_means;
Run;
We will obtain this resulting data.
Take note of the order that the data appears. First is the overall statistics with a _TYPE_ value of 0, followed by the sex statistics with a _TYPE_ value of 1, followed by the treatment statistics with a _TYPE_value of 2, followed by the sex*treatment statistics with a _TYPE_ value of 3. This is the way that SAS “thinks” – very ordered. Order is determined by the order of the variables listed in the CLASS statement. If you wanted the treatment means within each sex, then you would flip the two variables in the CLASS statement.
Saving certain statistics in Proc MEANS dataset
By default our dataset contains N, MIN, MAX, MEAN, and STD. We may not need all that information, most of the time, we only are interested in the MEAN, and maybe some measure of variation, let’s pick on STDERR.
So, how do we tell SAS that we only want these statistics in our dataset rather than the 5 default ones? Let’s first add some code to our output statement:
We want to save the mean – we tell SAS that we want the mean and we give it a new variable name – let’s call it measure_mean. We also want the standard error and we give it a new variable name of measure_stderr. The complete output statement reads as this:
output out=play_means mean=measure_mean stderr=measure_stderr;
To complete the Proc MEANS we now have:
Proc means data=play;
class trmt sex;
var measure;
output out=play_means mean=measure_mean stderr=measure_stderr;
Run;
Let’s take a look at the output dataset – remember NOTHING changes in the output – we still see the same table with the same information. We only changed what we want to save in the output dataset.
Here’s the new dataset in PDF file
All we have is one line for the overall mean and standard error, one line for each sex, and one line for each treatment, and one line for each sex*treatment combination.
Now that this is saved as a SAS dataset, we can use for future analyses.

3 thoughts on “Proc MEANS (November 10)”